• July 29, 2025, 7:00 am
• July 29, 2025, 2:13 am
• July 29, 2025, 12:07 am
• July 28, 2025, 6:53 pm
• July 28, 2025, 5:38 pm


This Bitcoin (BTC/USD) 15-minute chart shows a symmetrical triangle breakout. The pattern labeled A-B-C-D indicates consolidation within the triangle, followed by a bullish breakout. The price has broken above the upper trendline and is approaching the resistance zone around 118,800–119,400 USD. The chart suggests two scenarios:
Immediate breakout to the 119,400 resistance.
Short-term pullback to retest the breakout zone (~118,600), followed by a continuation to 119,400.
The setup implies a bullish bias with a potential upside target around 119,400 USD.
thanking you

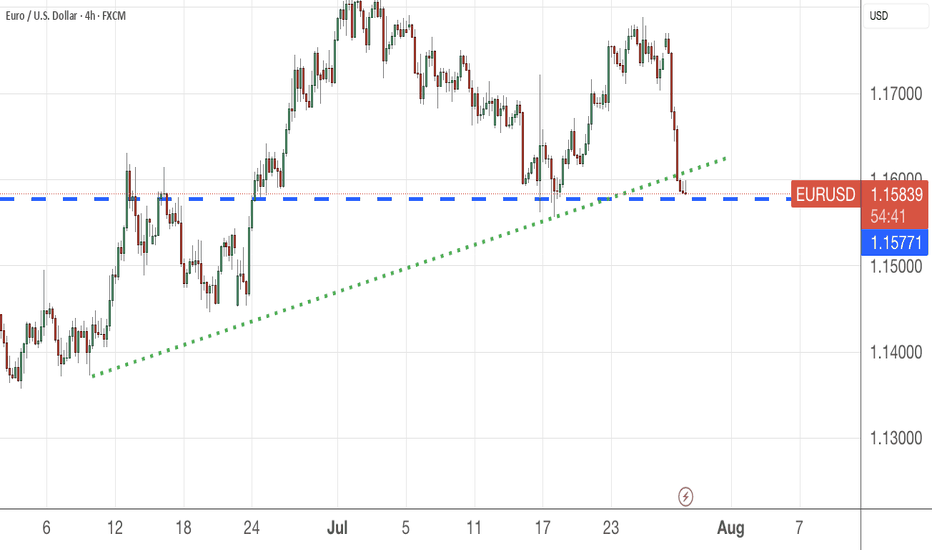
So my EURUSD pair was stopped out with a profit. Now, at this price level, it looks like the selling pressure is not finished so I will be waiting.......
As I want to LONG ONLY so I will not be shorting this pair for now.
Let's check back later to see how the price movement is

