

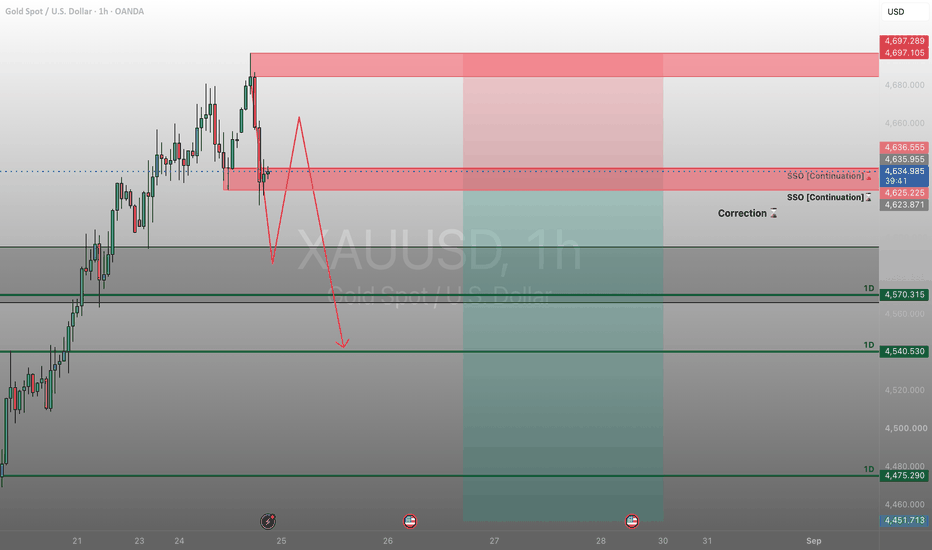
DXY and USDJPY Long | XAUUSD Correction
Action Items
-Wait for Gold to return to swing levels before entering short position, rather than chasing the current hourly break
- Place sell stop order on Gold once price returns to between the identified swing levels to target the downside
- Monitor Dollar Yen long position and watch caution zone around the one-day swing level
- Set and monitor alerts for Gold lower high formation, Dollar Yen bullish/bearish indications, and take-profit levels
- Watch Dixie for pullback as confirmation for broader market moves
Market Color Coding System
- Blue = bullish level; Red = bearish level; Gray = neutral
- Only closed candles are used to confirm level breaks
Gold Analysis
- Gold was initially marked neutral, then moved bullish (blue) as price pushed above key levels
- First bearish signal confirmed: hourly candle closed below the prior low, forming an official lower low — signaling the beginning of a potential correction
- Still in an overall uptrend on the daily timeframe, but showing exhaustion
- Two short setups identified:
- Setup 1: Entry from one-hour chart targeting the last four-hour swing level — 3:1 reward to risk
- Setup 2: Deeper four-hour level entry — 6.44:1 reward to risk
- Key discipline: waiting for price to return to between swing levels before entering, to avoid buying into remaining buyer strength
- Primary target: level 4451
- Best case scenario: Gold pulls back into the identified demand zone (rated A minus overall — B+ formation, A+ location), then reverses long into the supply area above
- The demand zone is seen as needing a revisit to gather enough buying orders to break through strong overhead seller levels
Dollar Index (Dixie) Analysis
- Dixie has been leading market moves; other markets are now “catching up”
- Expecting a significant pullback on Dixie — watching a key one-day swing level where price previously dropped
- A 1% move on Dixie is expected to translate to 100+ pips on EUR/USD and USD/JPY
- In a downtrend context, watching for a lower high formation in the current pullback area — if confirmed, continuation downward is expected
- If Dixie breaks above the key resistance at 101.521, the upper range could be targeted
- Bearish swing levels updated on chart; alert set for a lower high crossing down
Dollar Yen (USD/JPY) Analysis
- Was previously short, moved to neutral after getting a bearish signal, then switched to long after a bullish indication
- Long position started approximately 19 hours prior at entries around 159.26 and 159.317
- Caution noted around a one-day swing level that price must navigate
- Second position set with a stop loss just below a key level — 4:1 reward to risk
- Alert set: if price breaks below the four-hour swing level, that would be a bearish indication
- Watching for take-profit or hold decision as price approaches target
NASDAQ Analysis
- A four-hour demand zone identified and graded C — decent leg-in but lacking tight indecision candles preferred for higher-grade setups
- Price was watched from when it entered the zone and has begun to turn
- Key risk: Dixie and NASDAQ tend to be inverse — if Dixie continues higher, NASDAQ may break the demand zone and move lower
Trading Methodology Notes
- ICC framework used for swing level analysis and market structure
- Setup grading: formation quality + location quality scored separately (e.g., B+ formation + A+ location = A minus overall)
- FOMO management emphasized — waiting for price to return to levels rather than chasing breakouts
- Fibonacci retracement used to place alerts: typically at the 33–50% range to identify potential lower highs
- Alerts used to monitor: lower high formation, bullish/bearish momentum breaks, and take-profit zones
source https://www.tradingview.com/chart/XAUUSD/bzODhlva-DXY-and-USDJPY-Long-XAUUSD-Correction/


No comments:
Post a Comment