

JUP — Long-Term Downtrend Broken! Is a Major Reversal Starting?
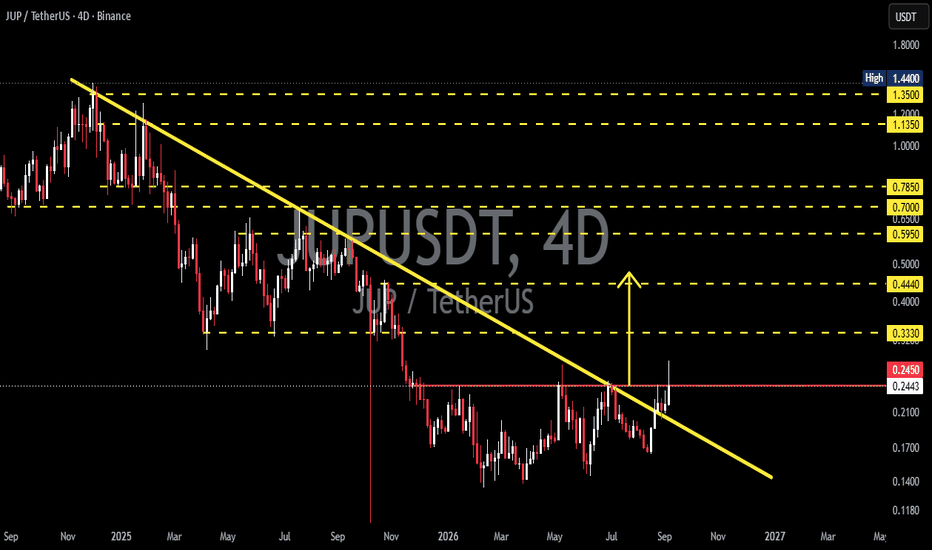
📊 Technical Analysis — JUP/USDT
⏳ Time Frame: 4D
💱 Exchange: Binance
💰 Current Price: around $0.244
📈 Pattern: Descending Trendline Breakout / Potential Trend Reversal
---
🔻 1. Previous Structure — Long-Term Downtrend
Since forming a high around $1.44, JUP has experienced consistent bearish pressure and formed a series of Lower Highs.
📉 The yellow line on the chart represents the Descending Trendline, which has acted as dynamic resistance throughout the downtrend.
As long as price remained below this trendline, the bearish structure remained dominant.
However, the situation is now beginning to change. 👀
---
🚀 2. Descending Trendline Has BREAKOUT
🟢 The breakout has occurred.
Price has successfully moved above the descending trendline, which is an important indication that the previous bearish momentum is beginning to weaken.
🔥 This breakout could represent an early confirmation that JUP is entering a transition phase:
Downtrend → Consolidation → Potential Uptrend
However, for stronger confirmation, price ideally needs to hold above the breakout area and avoid falling significantly back below the trendline.
---
🎯 3. Key Resistance — $0.245
⚠️ The $0.245 area is an important horizontal resistance level clearly visible on the chart.
Price is currently trading very close to this area.
If JUP manages to produce a solid 4D candle close above $0.245, the breakout would receive additional confirmation because price would not only be breaking the descending trendline, but also reclaiming the horizontal resistance.
📌 $0.245 = Key Confirmation Level
---
🟢 BULLISH SCENARIO
If price successfully breaks and closes above $0.245, bullish momentum could strengthen further. 🚀
🎯 Potential Targets:
🥇 $0.333 — First major resistance / target
🥈 $0.444 — Next resistance
🥉 $0.595 — Major resistance
🔥 $0.700 — Psychological & structural resistance
🚀 $0.785 — Major historical resistance
💎 $1.135 — Higher-timeframe target
🏆 $1.350 – $1.440 — Major resistance / previous high zone
If momentum and volume support the move, a breakout above $0.245 could open the door for a much larger recovery on the higher timeframe.
---
🔄 Retest Scenario
One healthy bullish scenario would be:
Breakout → Pullback → Retest Descending Trendline → Hold → Continuation Up
🟢 If the descending trendline, which previously acted as resistance, turns into support, this would strengthen the validity of the breakout.
📈 In other words, a successful retest that holds above the trendline could confirm that the market structure is genuinely beginning to change.
---
🔴 BEARISH SCENARIO
Even though the breakout has already occurred, there is still a risk of a false breakout. ⚠️
If price fails to hold the breakout area and moves lower:
🔻 Losing $0.245
🔻 Falling back below the descending trendline
🔻 Breaking down through breakout support
🔻 Forming a new Lower High
then the bullish breakout could become a fakeout.
Under such conditions, price could return to consolidation and retest lower support areas.
📉 The deeper price moves back below the trendline after the breakout, the weaker the validity of the bullish breakout becomes.
---
🧩 PATTERN EXPLANATION
📐 Descending Trendline Breakout
This pattern forms when price continues to create lower highs, causing diagonal resistance to move progressively lower.
On the JUP chart:
🔻 A long-term downtrend formed
🔻 Lower highs continued to follow the descending trendline
🔻 Bearish momentum began to weaken
🔻 Price broke above the trendline
🟢 Price is now attempting to confirm a structural shift
Therefore, this breakout can be considered a potential trend reversal signal, rather than merely a short-term price increase.
---
📌 KEY LEVELS TO WATCH
🟢 $0.245 — Breakout confirmation / key resistance
🎯 $0.333 — First major upside target
🚀 $0.444 — Second target
🔥 $0.595 — Major resistance
💎 $0.700 – $0.785 — Strong resistance zone
🏆 $1.135 – $1.350 — Higher-timeframe targets
👑 $1.440 — Previous major high
---
🔥 CONCLUSION
JUP is showing a significant structural shift after successfully breaking above the descending trendline that has constrained price throughout the long-term downtrend.
🟢 Trendline breakout = positive signal
🟢 Reclaiming $0.245 = stronger confirmation
🔄 Successful retest = bullish continuation signal
🎯 $0.333 becomes the next important resistance/target area
However, traders should continue to monitor whether the breakout can hold above the trendline and $0.245. If successful, JUP's structure could develop from a downtrend into a new recovery/uptrend.
⚠️ DYOR — Not Financial Advice.
#JUP #JUPUSDT #Jupiter #Crypto
source https://www.tradingview.com/chart/JUPUSDT/eI6ymO7G-JUP-Long-Term-Downtrend-Broken-Is-a-Major-Reversal-Starting/


No comments:
Post a Comment