

SMC Masterclass Pt 7: Imbalance Dynamics — Fair Value Gaps, BPR
🏛️ INSTITUTIONAL MASTERCLASS • PART 7 OF 15 📌 SMC Masterclass Pt 7: Imbalance Dynamics — Fair Value Gaps, BPR & Inversion IFVGs
Healthy markets operate on balanced two-way trade: for every buyer, there is a willing seller at that price.
However, when an institutional algorithmic program initiates an aggressive repricing drive, it delivers orders with such speed that liquidity is offered to only one side of the market. This creates a Fair Value Gap (FVG) or Market Imbalance.
1. Anatomy of a Fair Value Gap (FVG): An FVG is a 3-candle price pattern: Because the interbank algorithm is designed to seek fair value, price will frequently retrace back into that gap to re-offer liquidity to the bypassed counter-parties before resuming the dominant trend.
- Bullish FVG (BISI - Buy-Side Imbalance Sell-Side Inefficiency): Formed when Candle 2 explodes upward, leaving an empty gap between Candle 1 High and Candle 3 Low. Sell orders were completely bypassed. Bearish FVG (SIBI - Sell-Side Imbalance Buy-Side Inefficiency): Formed when Candle 2 dumps downward, leaving a void between Candle 1 Low and Candle 3 High.
2. Quantitative Formula: Consequent Encroachment (CE): Consequent Encroachment (CE) represents the exact 50% mathematical midpoint of the Fair Value Gap: CE = (High of Gap + Low of Gap) / 2 Algorithms love to rebalance price exactly to the 50% CE line. You do not need price to fill the entire gap (100% full fill); touching the CE is often sufficient for the algorithm to declare the auction balanced.
3. The Inversion Fair Value Gap (IFVG): What happens when a Fair Value Gap fails to hold? This is where many traders get caught, but on our desk, it provides some of the highest-conviction entries. When an existing Bullish FVG is violently sliced through and closed below by a strong candle body, that gap undergoes a Polarity Flip. It transforms into an Inversion Fair Value Gap (IFVG). On the next pullback, that failed support zone now acts as dynamic institutional resistance.
4. Balanced Price Range (BPR) - The Double Imbalance: A Balanced Price Range (BPR) is an elite institutional structure formed when an aggressive buying BISI is immediately engulfed by an aggressive selling SIBI within 1 to 2 candles (or vice-versa). This creates a double-sided imbalance over the exact same price coordinates. Because the algorithm delivered extreme buying and extreme selling back-to-back, the overlapping FVG zone acts as an iron-clad institutional support/resistance shelf on subsequent retests.
5. Liquidity Void (LV) vs Standard FVG: While a standard Fair Value Gap spans 3 candles with wicks on either side, a Liquidity Void (LV) is a violent, multi-candle vertical sprint or 'price vacuum' with little to no overlapping wick activity. Because liquidity was offered in only one direction over a wide price spectrum, the algorithm views a Liquidity Void as an unstable vacuum that ultimately demands 100% full rebalancing before sustainable trend expansion can continue.
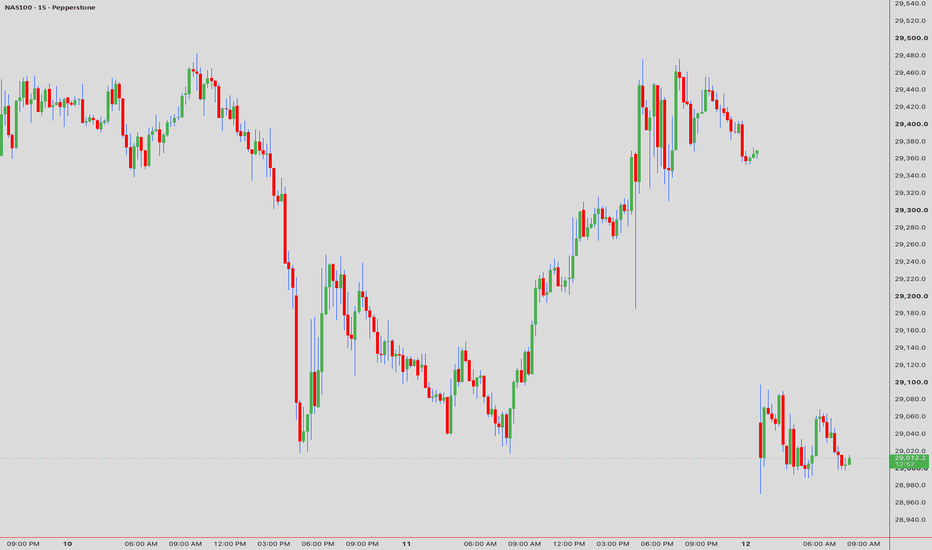
📊 Real-Time Tape Study (Look at the Attached NQ 15M Chart):
- Look at this live Nasdaq chart: Price printed a 3-candle bearish imbalance (SIBI) between 19,860 (Candle 1 Low) and 19,820 (Candle 3 High). The 50% Consequent Encroachment (CE) sits at 19,840. During the New York morning session, price pushed up into the gap. Notice how price pierced into the gap, touched 19,842 (just 2 ticks into CE), and instantly printed long upper wicks. Price rejected the CE line with extreme velocity, collapsing 120 points down toward the daily sell-side liquidity pool.
Execution Tip: Always align your FVG entries with higher timeframe trend bias. Never trade an isolated 1-minute FVG that sits in the middle of nowhere. Look for FVGs that originate from a high-timeframe Order Block or liquidity sweep.
I want to take a moment to commend the TradingView platform team: The precision of TradingView's volume profile and measurement tools when charting Nasdaq and S&P futures is unmatched in modern technical analysis.
💡 Key Institutional Takeaway:Monitoring how price interacts with the 50% Consequent Encroachment (CE) provides immediate confirmation whether an imbalance is acting as dynamic support/resistance or transitioning into an Inversion FVG.
⚖️ Educational Disclaimer:This tutorial is published strictly for technical analysis and educational purposes. It does not constitute financial, investment, or trading advice. Always manage your risk responsibly.
source https://www.tradingview.com/chart/NAS100/klgDe32D-SMC-Masterclass-Pt-7-Imbalance-Dynamics-Fair-Value-Gaps-BPR/


No comments:
Post a Comment